15 years of the London Heat Map
Fifteen years ago, the Centre for Sustainable Energy (CSE) launched the London Heat Map.
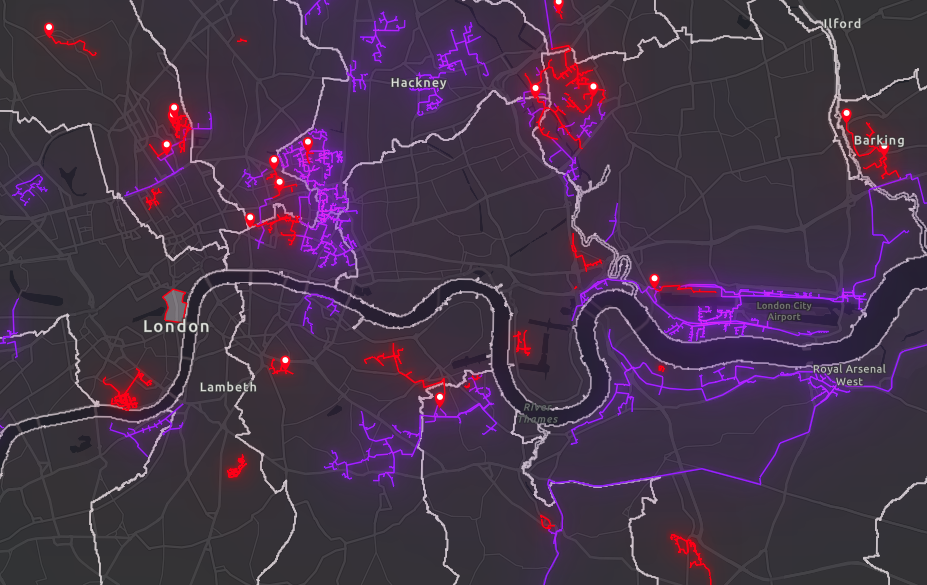
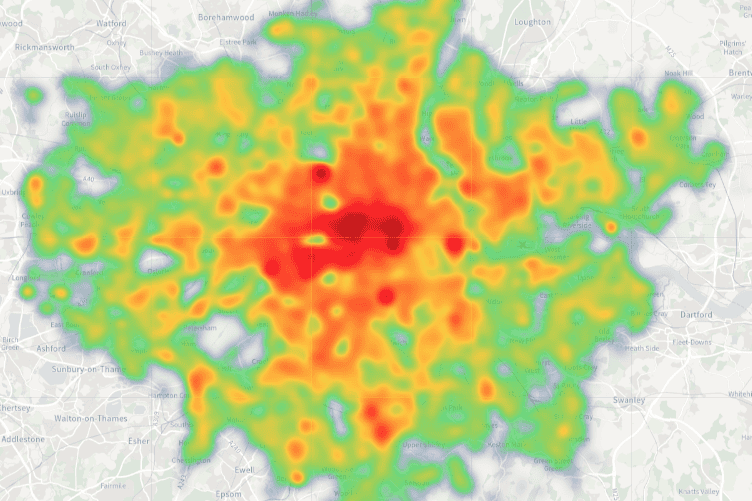
Developed in partnership between CSE and the Greater London Authority (GLA), the London Heat Map was an innovative digital tool designed to support the planning and development of large-scale heat networks.
CSE managed and maintained the National Heat Map from its inception in 2010 until earlier in 2025 when the GLA took it in-house. It’s still publicly available and can be seen here: https://apps.london.gov.uk/heatmap.
The inspiration for building the London Heat Map came from two pieces of government legislation: the 2008 Climate Change Act, and the 2009 UK Low Carbon Transition Plan. The latter in particular recognised the importance of heat decarbonisation to meeting the legal commitment to reducing carbon emissions laid down by the former. Prior to this heat planning was extremely limited.
Radical and unique
What made the London Heat Map both radical and unique in 2010 is that it made heat planning data freely available to everyone.
Quickly, it became the go-to resource for heat planning across London. Borough officers used it to identify heat network opportunities. Developers used it to inform planning applications. Community groups used it to understand heating in their neighbourhoods. Even individual Londoners curious about heating in their area accessed the site.
Over 15 years, nearly 1,000 heat networks had designs started in the London Heat Map. Of these, around 70 were developed to the point they could be carried forward to further feasibility work.
In 2019 the tool had an upgrade. New features included the ability to model building-level heat demands, an interactive heat network planning tool where users could draw their own networks, and additional datasets reflecting the changing patterns of heating across London.
Upgrade
Mark Gibbons, Senior Software Engineer at CSE, is proud of the work CSE did. “The London Heat Map interface was included in the textbook Data, Matter, Design as an example of great data visualisation. This confirmed the soundness of our design choices.”
Lewis McNamee, Senior Analyst at CSE, said “When working on other projects with London borough councils the London Heat Map is regularly referred to as a key data source. It’s always satisfying to hear those compliments – even when the clients don’t realise we built it!”
CSE has been proud to have managed and maintained the London Heat Map since its launch. Now, however, the GLA has brought the tool in-house. “We miss it,” said Mark. “But for users, it’s a positive step. The GLA has added new datasets and, following a data audit, removed some datasets and functionality. We’re confident it has a bright future ahead.”
You can see it at https://apps.london.gov.uk/heatmap.
Our app-building expertise
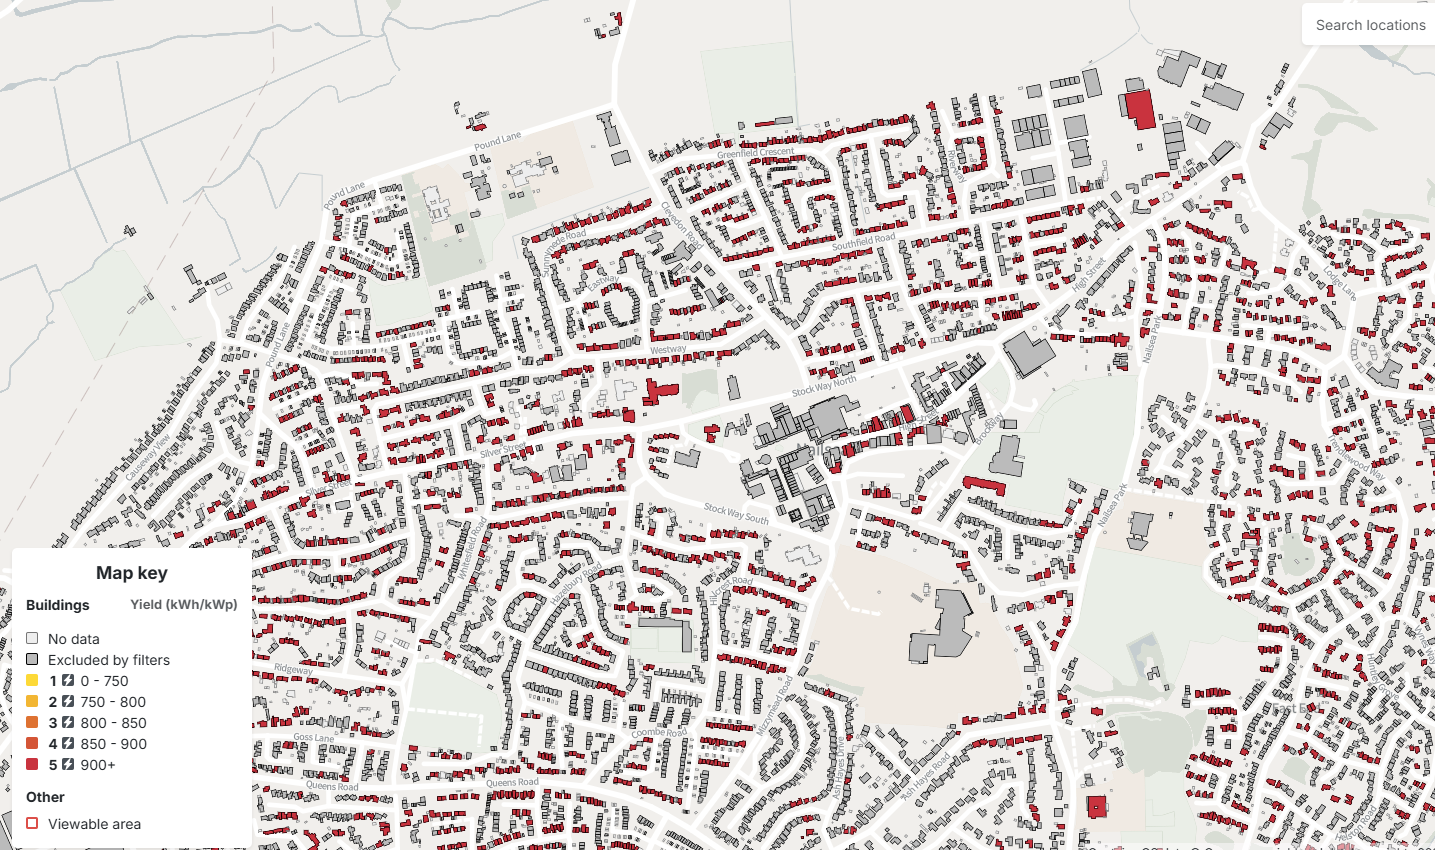
For CSE, the experience of building the London Heat Map shapes our approach to subsequent projects. Similar techniques underpin our work on the national heat zoning model, and we continue to conduct heat studies for many local authorities. We also continue to build tools to help everyone – for example Solar Wizard, which is helping increase uptake of solar PV on homes and across cities.
Interested in heat mapping or heat decarbonisation?
We’d love to explore how our expertise could support your region. Get in touch with Martin Holley, CSE’s Head of Technical Consultancy.
-
News

Improving heat network regulation
We broadly support recent heat network regulation proposals, but recommend improvements to benefit consumers while ensuring financial viability.
Policy Community energy -
Heat decarbonisation
Heat decarbonisation is one of the biggest challenges facing the UK as it works towards net zero. We work with the government, local authorities and o …
-
Project

London Heat Map: Informing a city’s decarbonisation plan
Pioneering heat decarbonisation in the UK’s capital
Policy Planning Renewables Behaviour change -
Project

Solar Wizard calculator
Solar Wizard is a household and community solar PV assessment calculator to support more people and communities to get solar power.
Community energy Planning Renewables Building performance