Measuring vulnerability for distribution network operators
Vulnerable customers are defined by Ofgem as those who are significantly less able to represent their interests in the energy market, or those who are significantly more likely to suffer detriment than the average energy consumer. In practice, “vulnerability” manifests itself in many ways. Those who are identified as “vulnerable” may be experiencing multiple and overlapping difficulties associated with health, disability, age, financial capability, or other issues. Ofgem places clear social obligations on Distribution Network Operators (DNOs) – the companies that operate and maintain the pylons, cables, and equipment that distribute electricity from the transmission grid to people’s homes – to deliver a range of services aimed at helping vulnerable customers.
DNOs offer a free support service, the Priority Services Register (PSR), to help people in vulnerable situations. Eligibility is wide-ranging (e.g., disabled or long-term medical condition, presence of young children, poor English skills, above state pension age). So is the help customers can get (e.g., priority support in an emergency, help with prepayment meter access, advance notice of planned power cuts).

CC image courtesy of Andrew Coombes via Flickr.
An important part of the ability to support these customers is having a clear understanding of the issues and situations that affect vulnerable people. For example, numbers of people registered on the PSR is not, in itself, sufficient to understand how customers are affected by power cuts. CSE has been providing data and analysis to DNOs for more than a decade to provide them with a greater understanding of how changing situations create different sorts of vulnerability (and what they can do to deal with these).
Our original project for WPD – Who’s On Our Wires?
Western Power Distribution (WPD), now known as National Grid Electricity Distribution (NGED), distributes electricity to over 8 million customers across an area of 55,500 km2 in the Midlands, South Wales and the South West. In 2012, we conducted a project called Who’s On Our Wires. We researched different segments of their customer base, using internal models and Experian’s geodemographic tool (Mosaic). This helped us understand how different demographics use energy and forecast future changes to electricity use and predict which substations these would affect. The research also showed how many of its customers were registered on the PSR compared to estimated eligibility, the location of customers who might be at risk in a power cut, and those who may be struggling to keep their home warm.
The research resulted in a number of targeted services to support these households. These include the Power Up Advice Hubs, Citizens Advice, Auriga, and the Energy Saving Trust.
Measuring and mapping vulnerability
Since Who’s On Our Wires, CSE has updated the original analysis by incorporating new datasets and expanding the number of DNOs to which we offer services. CSE currently conducts vulnerability and PSR analysis for NGED, Scottish and Southern Electricity Networks (SSEN), Scottish Power Energy Networks (SPEN), Electricity North West Limited (ENWL), and Cadent (a gas distribution company which owns, operates, and maintains the largest natural gas distribution network in Great Britain) to inform their work with vulnerable customers.
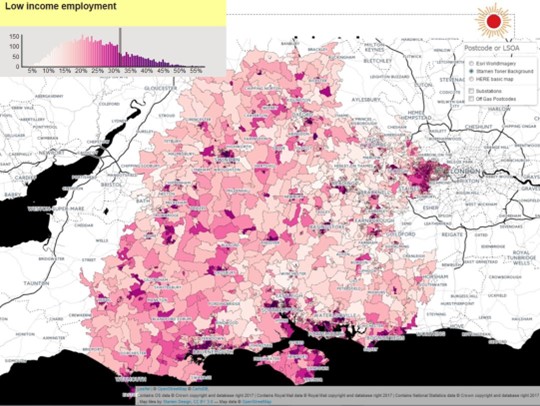
In 2016, CSE created an online map tool for SSEN that displays datasets relevant to vulnerability at a local authority and Lower Super Output Area (LSOA) level and allows SSEN staff to utilise the data in different ways. In 2017, CSE built an interactive Social Indicator Map for NGED which – in an innovative and pioneering step – was made public online “in order to help other organisations and agencies working in WPD’s region to support the most vulnerable in our society”. You can see the Social Indicator Map for NGED here and a screenshot from SSEN’s web app below. In 2018, CSE created similar online mapping tools displaying vulnerability/social indicators for ENWL and Cadent.
How our data helps
The DNOs that CSE support have used the data analysis and online vulnerability maps to:
- Understand locations of particular types of vulnerable situations across their network and how people are affected by these situations.
- Ensure those areas identified as most vulnerable are prioritised.
- Locate gaps in PSR coverage and plan where to focus recruitment initiatives.
- Assess how resilient different areas are (in relation to power outages, storms, floods, and power cuts).
Reviewing our research
We regularly review the datasets underpinning the online vulnerability maps to ensure they are up to date and to take into account changes to the definitions of vulnerability and fuel poverty (by Ofgem, UK government, and stakeholders). New data layers have also been added to help DNOs monitor trends in low carbon technology uptake in their regions: an example of which is “% of consumers with an EV charging point” in the NGED map.


