Building Heat Model

Developed by the Centre for Sustainable Energy (CSE) and the National Energy System Operator (NESO), the Building Heat Model is an Excel tool that generates realistic, synthetic half-hourly heating demand profiles -covering gas boilers, electric boilers, air- and ground-source heat pumps, and both combi and tank hot water systems.
Most existing heat modelling relies on gas boiler profiles. But heating technology fundamentally changes when and how households use energy, and those profiles don’t reflect how low-carbon systems actually operate. The Building Heat Model fills that gap, using inputs across occupant behaviour, weather, and building heat loss to produce technology-specific demand profiles that better reflect the real world.
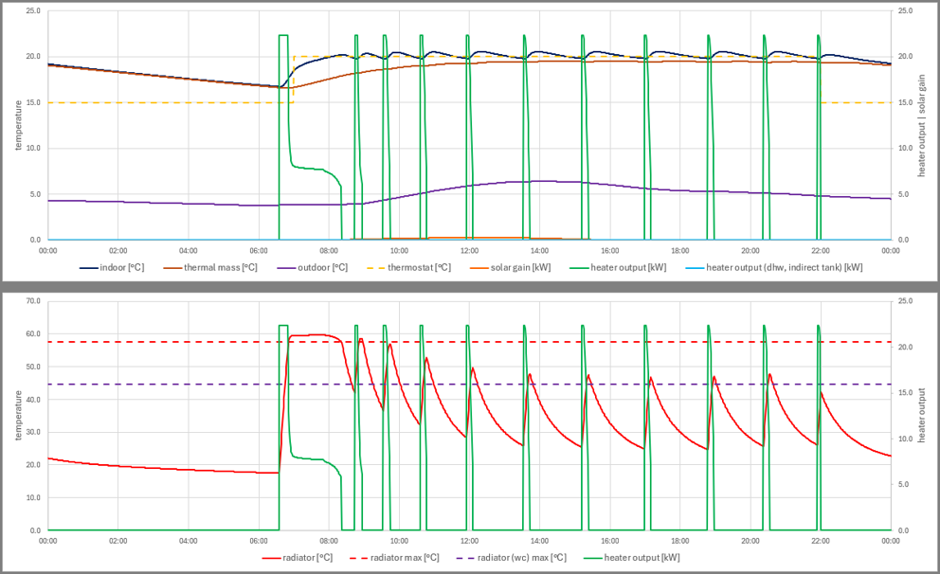
The top graph shows indoor temperature, building thermal mass temperature, outdoor temperature, thermostat temperature, solar gain, heater output for space heating, and indirect hot water tank heating.
The bottom graph shows radiator, radiator max, radiator max (in weather compensation mode) temperature as well as heater output for space heating.
Using the Building Heat Model tool
The model can generate a vast range of scenarios. Varying inputs from thermostat schedules and occupancy patterns to building fabric and weather means it can inform policy decisions and give a greater overall picture of household energy demand. Below are two examples of the model in use.
The impact of smart energy advice
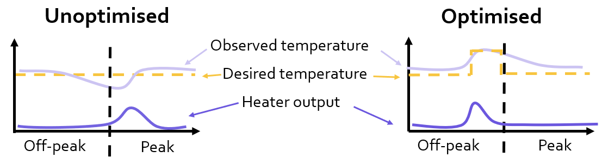
CSE has been using the Building Heat Model to calculate financial savings from smart energy advice delivered through CSE’s projects like Smart Energy Advice Plans (SMEAPs). Advice includes how to use heating controls for better optimisation and heating efficiency and shifting energy demand to make the most of cheaper “off-peak” energy, depending on an individual’s tariff.
For example, to model the value of heat pump advice, we used the Building Heat Model to construct a synthetic “typical” heat pump profile, for which we could simulate different scenarios. These scenarios were based on common pieces of advice shared by our advisors:
- Running the heat pump on a flatter thermostat schedule (e.g. “low and slow”).
- Switching to a heat pump specific time-of-use tariff.
- Optimising heat pump use based on the time-of-use tariff.
- Participating in flexibility services.
Across these four pieces of advice, our modelling suggested a “typical” heat pump household could stand to save about £300 a year compared to if they operated their heat pump like a gas boiler on a flat tariff.
The impact of decarbonising residential heating
NESO has used the model to investigate the overall cost impact of decarbonising residential heating in Great Britain. Different model input scenarios were created to capture the difference across households’ heating technology, performance, and behaviour and to better understand how variations can influence the overall cost of decarbonising home heating.
“The tool has been critical for generating internally consistent, technology specific heat demand profiles that capture differences in hourly patterns and annual demand due to changes in operating parameters and heating patterns across heat pumps and direct electric heating. The synthetic profiles from the Building Heat Model enabled the construction of robust counterfactual demand scenarios, which were then passed into our whole-system capacity expansion modelling to assess system cost impacts.”
Tim Mellor, Senior Energy Modelling Analyst at NESO
Ongoing potential for the Building Heat Model
Already, outputs from the Building Heat Model are providing vital insights into the energy system and we think there is great potential for future analysis on how different low carbon heating profiles shape and influence peak demand and the total system cost, including generation and network expansion, at a local and national level.
Use this modelling tool to generate realistic heat demand profiles that consider occupant behaviour an reflect how different heating technologies operate.
-
Heat decarbonisation
Heat decarbonisation is one of the biggest challenges facing the UK as it works towards net zero. We work with the government, local authorities and o …
-

Heat networks
We’ve built tools and models that help local authorities and consultants plan heat networks faster and more accurately.
-
Project
THERMOS
Software enabling local authorities, developers and consultants to scale up to meet heat networking planning project demands.